Economic Vibrancy Comparison/Report: The Cincinnati Region and Growth

By REDI Cincinnati Research Department, with contributions from Bryan McEldowney and Rosa Christophel
This is the first of a six-part series examining an economic comparison report led by REDI Cincinnati’s research team. The comparison benchmarked Cincinnati in six strategic areas—growth, talent, innovation, housing, prosperity, and inclusivity—against 39 peer MSAs ranging from 1-4.5 million people. In this first edition, Growth, or general economic indicators of vibrancy, will be examined.
Read the introduction to the blog series here.
Please note that each of the five areas examined below considers data from different time periods. The data used in this report is made publicly available at both different points in time and at varying intervals. For transparency, the time frames are noted in parentheses in each sections’ headline.
GROWTH
The Cincinnati region was in the midst of strong economic momentum entering 2020. Between 2014 and 2019, for example, the Cincinnati region’s gross regional product increased by more than 25%—the greatest pace of regional economic growth in at least a generation. Then, the Covid-19 pandemic applied the brakes to that momentum. In 2020, the tri-state’s gross regional product contracted and local employers shed thousands of jobs. Despite these disruptions, however, Cincinnati’s job losses proved less severe than in many other regions, its unemployment rate remains comparable to most benchmark areas and an economic rebound began much more quickly in Cincinnati than in peer metros.
- GDP (Data point in report 2019-2020)
Like most other major metropolitan areas, the Cincinnati economy was negatively impacted by the pandemic. Between 2019 and 2020, the gross regional product of many major metropolitans declined, and Cincinnati was no exception, with total gross regional product contracting by 2% (Graph 1). Among the 40 examined benchmark regions, Cincinnati ranked in the bottom half of communities in gross regional product growth during the height of the pandemic. At the time, the Queen City’s performance was a notable reverse from one year earlier when between 2018 and 2019 Cincinnati ranked 10th among benchmarked regions in gross regional product growth.
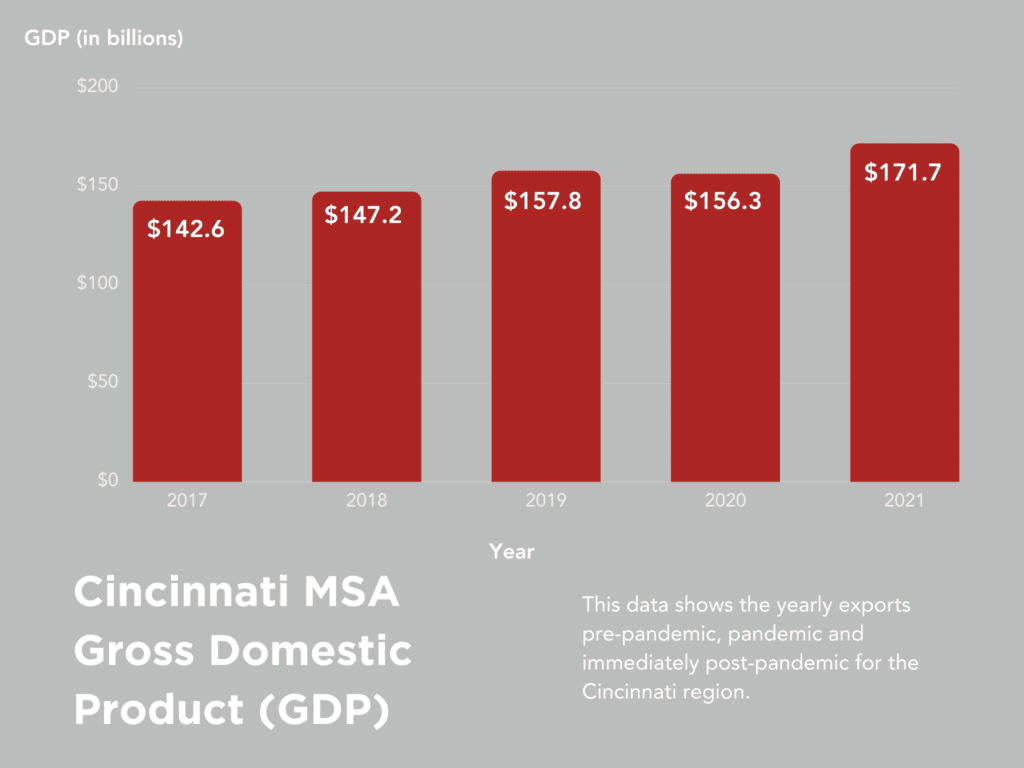
Graph 1: Cincinnati MSA Gross Domestic Product (GDP) from 2017-2021
However, Cincinnati avoided the same shrinkage as the rest of the country, which saw the national GDP decline by 3.5%. And that 2020 dip was followed by an incredible bounce back. Examining the difference in year-over-year Gross Domestic Product (GDP) data, Cincinnati’s GDP grew 9.85% in 2021 compared to the 2.2% contraction the year prior.[1]
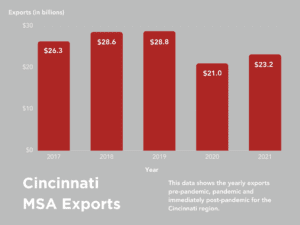
Graph 2: Cincinnati MSA Exports (GDP) from 2017-2021
The dip and immediate bounce back also appear in exports from the Cincinnati region to foreign countries as noted in Graph 2 above.
And as the Washington Post, Reuters and others have stated, 2020 was the worst year for economic growth since World War II,[2] but Cincinnati’s economic resiliency sped up recovery for the region.
- Net New Jobs (Data point in report from Sept 2020- Sept. 2021)
Between September 2020 and September 2021, nearly all examined benchmark regions experienced a net increase in employment, with New Orleans serving as the lone exception. The Cincinnati region added nearly 30,000 jobs during this period. While Cincinnati’s employment gains trailed most other regions on a proportional basis during this period, Cincinnati started from a comparatively stronger position; during the pandemic, job losses (see No. 4 below) in the Cincinnati region were less pronounced than most other benchmark regions.
Positive job growth continued in 2022 with growth of 3.9% year-over-year from September 2021 to September 2022, adding nearly 43,000 jobs during this time period.
- Aggregate Wage Growth (Percent change from Sept. 2020 – Sept. 2021)
Additionally, total aggregate wages[3] continue to increase. Between 2020 and 2021, total aggregate wages of all workers in the Cincinnati region increased 8.0%. The best-performing regions during this period—Las Vegas, Austin, Orlando and Seattle—include a mix of tech hubs that enjoyed relatively strong growth throughout the pandemic as well as tourist destinations that experienced a strong rebound through increased demand for hospitality hotspots.
- Unemployment Rate (Data in the report January 2022)
In other areas, however, Cincinnati appears to have avoided especially severe disruptions. Job losses in Cincinnati during the pandemic, for example, were more muted than the declines experienced in most examined benchmark regions. At the height of the pandemic in April and May 2020, the unemployment rate was respectively. Unemployment rates have fallen dramatically as the impact of the pandemic has gradually faded. At less than 4% in January 2022—preliminary February 2023 numbers indicate a 3.6% rate—the Cincinnati region’s unemployment rate is slightly greater than the median of the benchmarked regions (22nd), but the unemployment rate is back in line with pre-pandemic unemployment rates that generally hovered anywhere between 3.5 to 4.5%+/-. While an elevated unemployment rate is normally cause for concern, the comparative availability of labor in Cincinnati relative to other regions with extremely low unemployment rates may prove to be a competitive advantage.
- Labor Force participation rate, Labor force increase (Data in the report January 2021-Janurary 2022)
Much like the unemployment rate, labor force participation rates[4] have improved as the economic recovery has gathered steam. In Cincinnati, the labor force increased by nearly 2% between January 2021 and January 2022. While this growth rate also sits right at the median of the other benchmarked regions, it exceeds the figures posted by other leading Midwest metros such as Columbus and Indianapolis. In 2019, the Cincinnati Labor Force Participation rate hit a 6-year peak of 66.07%, and as of December 2022 sits at 63.14%.
Footnotes
[1] Note that 2022 GDP data has not been released as of publication of this post.
[2] https://www.washingtonpost.com/business/2021/01/28/gdp-2020-economy-recession/ , https://www.reuters.com/article/us-usa-economy/covid-19-savages-u-s-economy-2020-performance-worst-in-74-years-idUSKBN29X0I8 : Gross domestic product decreased 3.5% in 2020, the biggest drop since 1946. That followed 2.2% growth in 2019 and was the first annual decline in GDP since the 2007-09 Great Recession.”
[3] “Measuring wage growth at the economy-wide level relies on combining or “aggregating” data across individuals. Aggregation usually involves constructing a measure of the level of overall wages, or an average wage, with wage growth computed as the change in the average wage. ” per Cleveland Fed: source: https://www.clevelandfed.org/publications/economic-commentary/2020/ec-202019-aggregation-matters-for-wage-growth
[4] The U.S. Bureau of Labor Statistics defines the labor force as anyone 16 and older classified as employed or unemployed, or more simply, those either working or actively looking to work. Participation rate is the percentage of the labor force as compared to the total civilian noninstitutional population. (https://www.bls.gov/cps/definitions.htm)